I'm not saying that GPS tracklogs, and elevation gains derived from them, are wonderfully accurate. After all, they work by averaging and smoothing data containing a relatively large error component.
Given a set of values, recorded at 1 second intervals with a possible error of 4m on each value there's no way to know whether a series like this:-
0m, 0m, 0m, 0m, 0m could represent something perfectly flat or something that undulates as 0m, 4m, -4m, 4m, 0m, or vice versa.
What you can do though, with reasonable accuracy, is fine the peak/nadir of each hill with relatively good accuracy and calculate the size of the major climbs. If each point has a possible 4m error then 16m total error (top+bottom) on a climb of 300m is not bad.
I joined in this thread to refute the claim that Memory-Map/Tracklogs altitude measurements were trustworthy when they are easily demonstrated not to be, and also to point out that GPS elevation plots shouldn't be taken as truth either, as they are also inherently flawed.
As I said, I'm building up a log of laps of Richmond Park logged at 1 trackpoint per second. Here's an example of a profile plot of 3 laps (plus a short ride to/from the park):-
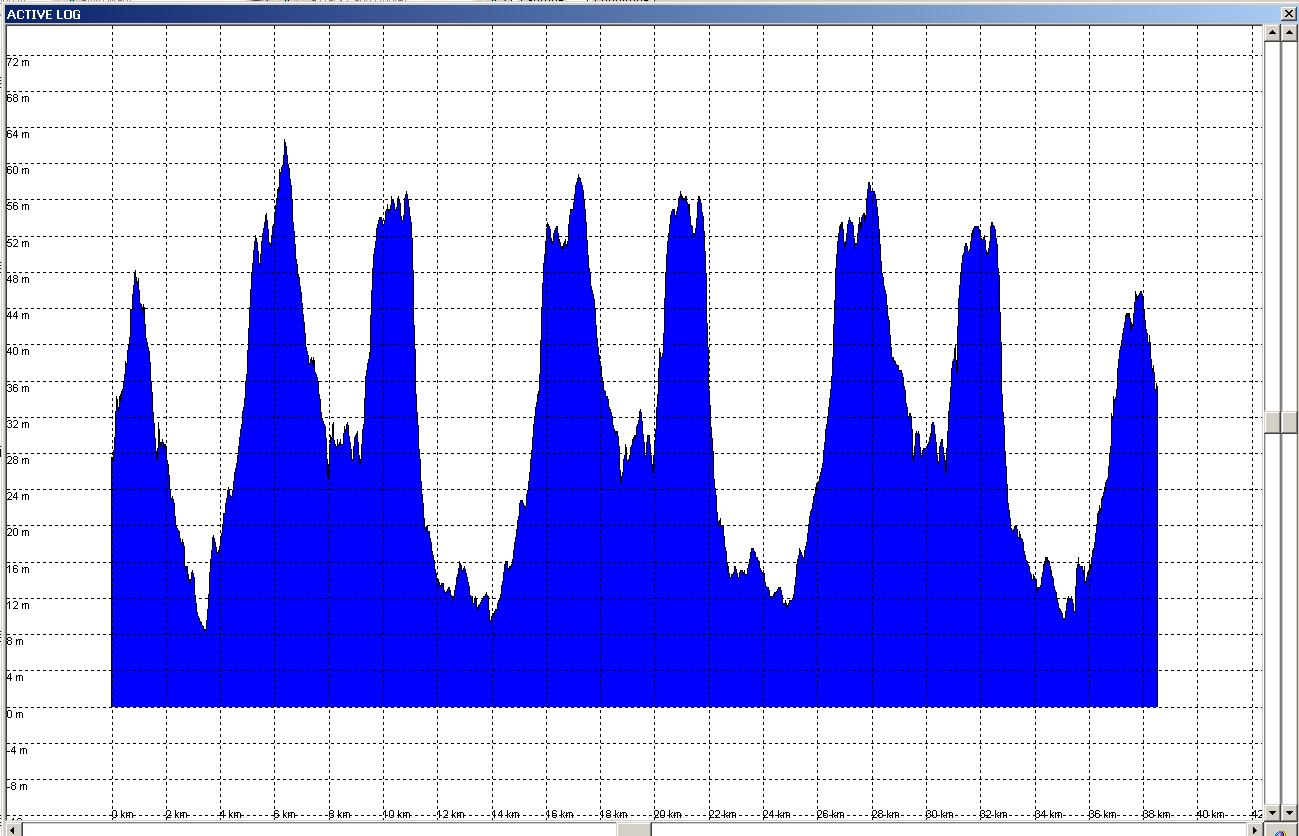
(The lap starts at about 3.75km in and each lap is 10.67km long.)
It's immediately obvious that there are differences between each of the 3 laps, despite it being exactly the same route each time.
I intend to take these GPX logs and produce a plot of the profile of a lap. Since there's no guarantee that I'll get a point at exactly the same place each time I'm going to rely on the fact that it's a circular route. I pick a single point in the centre of the park and, for each point in the GPX file, calculate a bearing to this point from the central point. I then plot GPX elevation against bearing (0 to 359 degrees). Once I'm plotted all 100 laps I can calculate a best guess at the true profile of the lap and then work out the climbing.
From your contentions it may well be that that figure is equally inaccurate, I suppose, but at least it's the same each time!
True, but for a specific route there is one true figure for climbing.
I would expect that, if repeated enough times, the figure from a GPS being +/- 4m accuracy for a specific point, would average out to roughly the right number. There are other factors at play as you point out (tree cover, buildings reflecting signals, etc). However, this is just a single point.
Where GPS tracklog analysers fail is there calculation of ascent. If you take every reading as truth then you get insanely over-rated climbing figures, especially if the trackpoints are logged at a high frequency. Garmin Training Centre gives me ~250m of climb for my commute which is pretty much flat alongside the Thames. There's probably 20m of climb on the way in (Putney Bridge and Lambeth Bridge) and 40m on the way home (I live about 25m ASL, work is 3m ASL).
I'm trying to write something that makes a better effort at picking out the peaks/troughs of climbs and calculates the differences between these two, ignoring any minor glitches on the way up. Ideally you'd feed it a GPX tracklog and it would spit out a figure more inline with proper climbing. Eventually I want it to generated an expanded profile plot annotated with the appropriate lines for peaks/troughs so you can see what it has included, and what it has ignored.

